
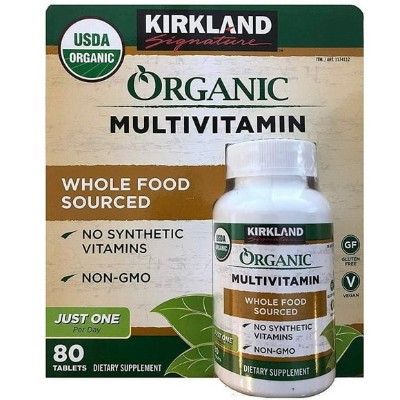

$75.00 $1.25 per serving


Product analysis
Source of Life Gold Tablets can help fill nutrient gaps relevant to normal energy use and immune function. Several blends leave their individual components undisclosed, making the full formula difficult to compare.
AI assessment of the formula, label and price. How scoring works
Nutrient Quality51
Several vitamins use suitable forms, including folate and vitamins D and E. Mineral mixtures with unclear proportions and unidentified blend components prevent a confident judgment of the whole formula.
Ingredient Transparency70
All listed ingredient and blend amounts are stated, and most forms are identified. Missing blend components and mixture proportions leave important details unclear.
Value For Money27
The serving cost offers weak value for many individual nutrient and plant contributions. The breadth of the formula does not by itself establish that the extra cost is worthwhile.
Customer Satisfaction85
Customer ratings are very positive across more than a thousand reviews. The review count gives a broad view of satisfaction without proving health benefits.
Product Focus0
The broad nutrient mix mainly supports filling dietary gaps. Numerous additions and unidentified blend components make a specific benefit from the full combination less clear.
- Format
Tablet - Container
- 180 Tablet(s)
- Per serving
- $1.25
- Customer rating
- 4.7 · 1,958 ratings
Goals

Impact
High effect
Vitamin K · 100 mcgMagnesium · 125 mgCalcium · 250 mgVitamin D · 1000 IUCopper · 4.5 mgManganese · 4 mgBoron · 1 mgZinc · 15 mgVitamin C · 1010 mg

Impact
High effect
Magnesium · 125 mgVitamin C · 1010 mgZinc · 15 mgVitamin A · 15000 IUVitamin D · 1000 IUSelenium · 70 mcg

Impact
Highest effect
Folate · 425 mcgVitamin B12 · 1000 mcgVitamin D · 1000 IUMagnesium · 125 mgVitamin K · 100 mcgBoron · 1 mgSelenium · 70 mcgZinc · 15 mgVitamin C · 1010 mg
Coenzyme Q10 Not classified
No linked studies yet.
Impact
High effect
Vitamin K · 100 mcgMagnesium · 125 mgCoenzyme Q-10 · 50 mgVitamin B12 · 1000 mcgVitamin B6 · 30 mgFolate · 425 mcgVitamin D · 1000 IU

Impact
Moderate effect
Iodine · 150 mcgVitamin D · 1000 IUVitamin B5 · 125 mgMagnesium · 125 mgRiboflavin · 30 mgThiamin · 30 mgVitamin B12 · 1000 mcgPotassium · 50 mgCoenzyme Q-10 · 50 mg
Vitamin B5 Not classified
No linked studies yet.

Impact
Moderate effect
Biotin · 300 mcg
Magnesium Not classified
No linked studies yet.
Ingredients
| Ingredient | Amount per serving | Score |
|---|---|---|
Calories | 5 Calorie(s) | |
Protein | 1 Gram(s) | |
Vitamin A (Beta Carotene, Lutein, Lycopene, Xanthophylls, Zeaxanthin) | 15000 IU | |
Vitamin C (Ascorbic Acid, Esterified-C) | 1010 mg | |
Vitamin D3 (Lichen) | 1000 IU | |
Vitamin E (D-Alpha-Tocopheryl Succinate) | 250 IU | |
Vitamin K2 (Menaquinone-4, Menaquinone-7) | 100 mcg | |
Thiamin (Thiamin HCl) | 30 mg | |
Riboflavin | 30 mg | |
Niacin (Niacinamide) | 125 mg | |
Vitamin B6 (Pyridoxine Hydrochloride) | 30 mg | |
Folate (Calcium L-5-Methyltetrahydrofolate) | 425 mcg | |
Vitamin B12 (Methylcobalamin) | 1000 mcg | |
Biotin | 300 mcg | |
Pantothenic Acid (Calcium Pantothenate) | 125 mg | |
Calcium (Calcium Citrate, D-Calcium Phosphate, Spirulina platensis, Whole Foods) | 250 mg | |
Iodine (Kelp, Potassium Iodide) | 150 mcg | |
Magnesium (Magnesium Aminoate complex) | 125 mg | |
Zinc (Zinc Aminoate, Zinc Picolinate) | 15 mg | |
Selenium (Selenium Aminoate Complex) | 70 mcg | |
Copper (Chlorophyllin, Copper Aminoate Complex) | 4.5 mg | |
Manganese (Manganese Aminoate Complex) | 4 mg | |
Chromium (Chromium Aminoate Complex) | 120 mcg | |
Potassium (Potassium Aminoate Complex, Spirulina) | 50 mg | |
Whole Food PhytoAlgae & Organic Mushroom Blend | 800 mg | |
Multi Color Whole Food Blend | 725 mg | |
Amino Acids (Chia, Mineral Aminoates, Spirulina, Whole Food PhytoAlgae) | 510 mg | |
Whole Food Omega Fatty Acid and Prebiotic Fiber Blend | 200 mg | |
Enzyme Blend | 100 mg | |
Anti-Aging Blend | 50 mg | |
Trans-Resveratrol (Grape seed concentrate, Polygonum cuspidatum, Red Wine concentrate) | 50 mg | |
Coenzyme Q10 | 50 mg | |
Inositol | 50 mg | |
Bioflavonoid Complex (Citrus spp., Flavanols, Flavanones, Flavones, Phenolic compounds) | 30 mg | |
Whole Food Fiber Complex | 30 mg | |
Choline (Choline Bitartrate) | 30 mg | |
Korean Ginseng | 25 mg | |
PABA | 25 mg | |
Quercetin (Dimorphandra mollis) | 10 mg | |
Trace Mineral Complex | 10 mg | |
Chlorophyll (Spirulina) | 7.5 mg | |
Rutin (Sophora japonica) | 5 mg | |
Hesperidin Complex (Citrus aurantium) | 5 mg | |
Carotenoids | 5 mg | |
Lutein (active Carotenoid) | 4 mg | |
Lycopene | 2.5 mg | |
Full Spectrum Probiotic Blend | 2 mg | |
Streptococcus thermophilus | 2 mg | |
Boron (Boron Citrate) | 1 mg | |
Octacosanol | 200 mcg |
Manganese (Manganese Aminoate Complex) · 4 mg OverallScore72
A serving provides 4 mg of manganese at a high cost per serving. It uses Manganese Aminoate.
How this ingredient is rated
Active Ingredient Quality & Bioavailability70
It uses Manganese Aminoate.
Manganese Chemical Form
It uses Manganese Aminoate.
Dose, Safety & Label Transparency100
A serving provides 4 mg of manganese.
Manganese Dosage Efficacy & Safety
A serving provides 4 mg of manganese.
Elemental Weight Disclosure
The manganese amount per serving is stated.
Value20
The cost per serving is high.
Price per Serving vs. Median
The cost per serving is high.
PABA · 25 mg OverallScore78
The serving provides 25 mg of PABA, with a high estimated cost per 100 mg based on the full serving price. That estimate may overstate the cost of PABA itself. No pharmaceutical grade or high-purity designation is stated in the available information.
How this ingredient is rated
Active Ingredient Quality & Bioavailability80
PABA is named, but a pharmaceutical grade or high-purity designation is not stated in the available information.
PABA Source & Grade
PABA is named, but a pharmaceutical grade or high-purity designation is not stated in the available information.
Dose, Safety & Label Transparency95
The selected serving states 25 mg of PABA. No artificial colors, titanium dioxide or hydrogenated oils are recorded in the available information.
PABA Dosage Alignment
The selected serving states 25 mg of PABA.
Label Disclosure Clarity
The selected serving states 25 mg of PABA.
Additive and Excipient Quality
No artificial colors, titanium dioxide or hydrogenated oils are recorded in the available information.
Value40
The estimated cost per 100 mg of PABA is high; using the full serving price may overstate the cost attributable to PABA.
Price per 100mg PABA
The estimated cost per 100 mg of PABA is high; using the full serving price may overstate the cost attributable to PABA.
Vitamin B12 (Methylcobalamin) · 1000 mcg OverallScore84
Each serving supplies 1,000 mcg of B12, at a high estimated cost per 1,000 mcg. It uses methylcobalamin, an active form of B12.
How this ingredient is rated
Active Ingredient Quality & Bioavailability100
It uses methylcobalamin, an active form of B12.
Bioactive B12 Form Selection
It uses methylcobalamin, an active form of B12.
Dose, Safety & Label Transparency100
1,000 mcg per serving is within the range described for people with higher needs. The label states both the amount and methylcobalamin form.
Therapeutic Dosage Level
1,000 mcg per serving is within the range described for people with higher needs.
Label and Form Transparency
The label states both the amount and methylcobalamin form.
Value20
The estimated cost per 1,000 mcg of B12 is high.
Price per 1,000 mcg B12
The estimated cost per 1,000 mcg of B12 is high.
Sources
Published studies used for the product analysis and the top-ranked studies for each ingredient and goal.
- [Comparative study of the urinary excretion of boron, calcium, magnesium and phosphorus in postmenopausal women with and without osteoporosis].
- Effect of dietary boron on mineral, estrogen, and testosterone metabolism in postmenopausal women.
- The relationship between boron and magnesium status and bone mineral density in the human: a review.
- Effects of boron supplementation on bone mineral density and dietary, blood, and urinary calcium, phosphorus, magnesium, and boron in female athletes.
- Metabolic responses of postmenopausal women to supplemental dietary boron and aluminum during usual and low magnesium intake: boron, calcium, and magnesium absorption and retention and blood mineral concentrations
- What is the impact of daily oral supplementation of vitamin D3 (cholecalciferol) plus calcium on the incidence of hip fracture in older people? A systematic review and meta-analysis.
- Calcium supplementation prevents seasonal bone loss and changes in biochemical markers of bone turnover in elderly New England women: a randomized placebo-controlled trial.
- The effects of calcium supplementation (milk powder or tablets) and exercise on bone density in postmenopausal women.
- The efficacy of calcium supplementation alone in elderly Thai women over a 2-year period: a randomized controlled trial.
- Calcium-enriched foods and bone mass growth in prepubertal girls: a randomized, double-blind, placebo-controlled trial.
- The Association between Dietary and Circulating Copper Levels and Osteoporosis: a Scoping Review.
- Association between dietary copper, iron, zinc, selenium intake and osteopenia or osteoporosis in elderly hypertensive patients: a retrospective cohort study.
- Associations of dietary copper intake with total bone mineral density and lumbar spine bone mineral density in American adults.
- The association between dietary mineral intake and bone mineral density: a cross-sectional study.
- Association between dietary copper intake and bone mineral density in children and adolescents aged 8-19 years: A cross-sectional study.
- Association between RBC folate and lumbar bone mineral density in postmenopausal women, a cross-sectional study from NHANES 2009-2018.
- Genetic variants modify the associations of concentrations of methylmalonic acid, vitamin B-12, vitamin B-6, and folate with bone mineral density.
- Adequate Intake and Supplementation of B Vitamins, in Particular Folic Acid, can Play a Protective Role in Bone Health.
- Relation of homocysteine, folate, and vitamin B12 to bone mineral density of postmenopausal women.
- Dietary intake of folate, but not vitamin B2 or B12, is associated with increased bone mineral density 5 years after the menopause: results from a 10-year follow-up study in early postmenopausal women.