
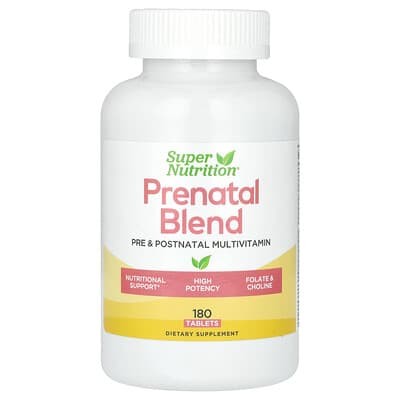

$22.77 $0.37 per serving


Product analysis
Prenatal Blend combines nutrients that support normal energy use and blood formation when intake is low. Missing amounts and forms make it difficult to check how the full mixture fits individual nutritional needs.
AI assessment of the formula, label and price. How scoring works
Nutrient Quality20
Most individual preparations are unspecified, leaving their relative quality uncertain. The broad combined listing does not provide enough clarity to judge each component separately.
Ingredient Transparency22
Most individual amounts and preparations are missing, making the serving difficult to check. Composition details are also largely undisclosed, with some remaining unknown.
Value For Money50
The riboflavin contribution offers favorable serving value, while folate value is limited. Most other contributions cannot be valued confidently, so the full formula remains difficult to compare.
Customer Satisfaction81
Customer ratings are generally favorable across a substantial review base. That offers useful feedback, without establishing prenatal nutritional suitability.
Product Focus53
The broad mixture is most relevant to filling nutritional gaps across several normal functions. Its many proposed uses make it difficult to connect the whole formula to one particular need.
- Format
Tablet - Container
- 180 Tablet(s)
- Per serving
- $0.37
- Customer rating
- 4.5 · 1,927 ratings
Goals

Impact
Moderate effect
Iodine · 145 mcgVitamin D · 50 mcgVitamin B5 · 87.5 mgMagnesium · 325 mgRiboflavin · 35 mgThiamin · 37.5 mgVitamin B12 · 125 mcgIron · 20 mg
Vitamin B5 Not classified
No linked studies yet.

Impact
Highest effect
Vitamin K · 85 mcgMagnesium · 325 mgCalcium · 600 mgVitamin D · 50 mcgCopper · 1.25 mgManganese · 5 mgBoron · 1.5 mgZinc · 15 mgVitamin C · 600 mg

Impact
Highest effect
Magnesium · 325 mgVitamin C · 600 mgZinc · 15 mgVitamin A · 750 mcgVitamin D · 50 mcgSelenium · 125 mcg

Impact
Highest effect
Folate · 500 mcgVitamin B12 · 125 mcgVitamin D · 50 mcgMagnesium · 325 mgVitamin K · 85 mcgBoron · 1.5 mgSelenium · 125 mcgZinc · 15 mgVitamin C · 600 mg
Impact
High effect
Vitamin K · 85 mcgMagnesium · 325 mgVitamin B12 · 125 mcgVitamin B6 · 35 mgFolate · 500 mcgVitamin D · 50 mcg

Impact
High effect
Biotin · 330 mcgVitamin D · 50 mcgZinc · 15 mgIron · 20 mgVitamin C · 600 mg
Ingredients
| Ingredient | Amount per serving | Score |
|---|---|---|
Vitamin A (Retinyl Palmitate) | 750 mcg | |
Vitamin C (Ascorbic Acid) | 600 mg | |
Vitamin D (Cholecalciferol, Vitamin D3) | 50 mcg | |
Vitamin E (D-Alpha-Tocopheryl Succinate, Mixed Tocopherols) | 180 mg | |
Vitamin K (Vitamin K1, Vitamin K2) | 85 mcg | |
Thiamine (Thiamine Hydrochloride) | 37.5 mg | |
Riboflavin | 35 mg | |
Niacin (Niacinamide, Nicotinic Acid) | 61 mg | |
Vitamin B6 (Pyridoxal 5-Phosphate, Pyridoxine Hydrochloride) | 35 mg | |
Folate | 850 mcg DFE | |
Folic Acid | 500 mcg | |
Vitamin B12 (Methylcobalamin) | 125 mcg | |
Biotin (D-Biotin) | 330 mcg | |
Pantothenic Acid (D-Calcium Pantothenate) | 87.5 mg | |
Choline (Choline Bitartrate) | 50 mg | |
Calcium (Calcium Carbonate, Calcium Citrate) | 600 mg | |
Iron (Ferrous Carbonyl) | 20 mg | |
Iodine (Kelp) | 145 mcg | |
Magnesium (Magnesium Glycinate, Magnesium Oxide) | 325 mg | |
Zinc (Zinc Citrate, Zinc Oxide) | 15 mg | |
Selenium (Sodium Selenite) | 125 mcg | |
Copper (Copper Glycinate) | 1.25 mg | |
Manganese (Manganese Citrate, Manganese Sulfate) | 5 mg | |
Chromium (Chromium Picolinate) | 125 mcg | |
Molybdenum (Molybdenum Amino Acid Chelate) | 75 mcg | |
Botanical Blend | 200 mg | |
Papaya | 0 NP | |
Rose Hips | 0 NP | |
Alfalfa | 0 NP | |
Kale | 0 NP | |
Broccoli | 0 NP | |
Spirulina | 0 NP | |
Prune | 0 NP | |
Betaine (Betaine Hydrochloride) | 50 mg | |
Inositol | 37.5 mg | |
Glutamic Acid (Glutamic Acid Hydrochloride) | 15 mg | |
Mixed Tocopherols (D-Alpha-Tocopherol, D-Beta-Tocopherol, D-Delta-Tocopherol, D-Gamma-Tocopherol) | 5.5 mg | |
Hesperidin (Citrus) | 2.5 mg | |
Rutin | 2.5 mg | |
Boron (Boron Citrate) | 1.5 mg | |
Citrus Bioflavonoids (Lemon) | 1 mg | |
Gamma-Linolenic Acid (Borage Seed Oil Extract) | 1 mg |
Calcium (Calcium Carbonate, Calcium Citrate) · 600 mg OverallScore77
The serving provides 600 mg of calcium at a moderate cost per serving. The calcium comes from Calcium Carbonate and Calcium Citrate, but their proportions are not disclosed. A flow agent is listed.
How this ingredient is rated
Active Ingredient Quality & Bioavailability69
The calcium amount is stated and comes from Calcium Carbonate and Calcium Citrate, with proportions undisclosed.
Calcium Form & Absorption Potential
The calcium comes from Calcium Carbonate and Calcium Citrate, but their proportions are not disclosed.
Elemental Calcium Transparency
The label states 600 mg of calcium per serving and names its source.
Dose, Safety & Label Transparency84
A serving provides 600 mg of calcium. A flow agent is listed.
Absorption-Optimized Serving Dose
A serving provides 600 mg of calcium.
Formulation Purity & Additives
A flow agent is listed.
Value80
The cost per serving is moderate.
Price Per Serving Efficiency
The cost per serving is moderate.
Copper (Copper Glycinate) · 1.25 mg OverallScore90
The serving supplies 1.25 mg of copper. The cost per serving is moderate. The copper source is Copper Glycinate. It also contains 15 mg of zinc.
How this ingredient is rated
Active Ingredient Quality & Bioavailability100
The copper source is Copper Glycinate.
Copper Form Bioavailability
Copper Glycinate is an amino acid chelate.
Elemental Copper Labeling Clarity
The copper amount and Copper Glycinate source are stated together.
Dose, Safety & Label Transparency86
The serving supplies 1.25 mg of copper. The serving also has 15 mg of zinc, giving a zinc-to-copper ratio of about 12:1.
Copper Dosage Safety & Efficacy
The serving supplies 1.25 mg of copper.
Zinc-to-Copper Balance
The serving also has 15 mg of zinc, giving a zinc-to-copper ratio of about 12:1.
Value80
The cost per serving is moderate.
Price Per Serving Efficiency
The cost per serving is moderate.
The serving provides 35 mg of vitamin B6 at a low cost per mg, making it a high amount for that price. It names Pyridoxal 5-Phosphate and Pyridoxine Hydrochloride as the B6 source, but the proportions are not disclosed. The serving exceeds the European adult upper limit of 12 mg per day. The listed additive findings show no artificial dyes, titanium dioxide or talc.
How this ingredient is rated
Ingredient Form & Label Quality100
It names Pyridoxal 5-Phosphate and Pyridoxine Hydrochloride as the B6 source, but the proportions are not disclosed. The Other Ingredients findings indicate no artificial dyes, titanium dioxide or talc.
Vitamin B6 Form Identification
It names Pyridoxal 5-Phosphate and Pyridoxine Hydrochloride as the B6 source, but the proportions are not disclosed.
Clean Label and Excipient Purity
The Other Ingredients findings indicate no artificial dyes, titanium dioxide or talc.
Dose, Safety & Label Transparency51
The label states 35 mg of B6 per serving and identifies its source. The serving exceeds the European adult upper limit of 12 mg per day.
Vitamin B6 Dose & Safety Policy
The serving contains 35 mg of B6. The serving exceeds the European adult upper limit of 12 mg per day.
Label Transparency
The chemical source of vitamin B6 is identified.
Value89
The cost per mg of B6 is low.
Vitamin B6 Price Efficiency
The cost per mg of B6 is low.
Alternative products
Report alternatives
Sources
Published studies used for the product analysis and the top-ranked studies for each ingredient and goal.
- [Comparative study of the urinary excretion of boron, calcium, magnesium and phosphorus in postmenopausal women with and without osteoporosis].
- Effect of dietary boron on mineral, estrogen, and testosterone metabolism in postmenopausal women.
- The relationship between boron and magnesium status and bone mineral density in the human: a review.
- Effects of boron supplementation on bone mineral density and dietary, blood, and urinary calcium, phosphorus, magnesium, and boron in female athletes.
- Metabolic responses of postmenopausal women to supplemental dietary boron and aluminum during usual and low magnesium intake: boron, calcium, and magnesium absorption and retention and blood mineral concentrations
- What is the impact of daily oral supplementation of vitamin D3 (cholecalciferol) plus calcium on the incidence of hip fracture in older people? A systematic review and meta-analysis.
- Calcium supplementation prevents seasonal bone loss and changes in biochemical markers of bone turnover in elderly New England women: a randomized placebo-controlled trial.
- The effects of calcium supplementation (milk powder or tablets) and exercise on bone density in postmenopausal women.
- The efficacy of calcium supplementation alone in elderly Thai women over a 2-year period: a randomized controlled trial.
- Calcium-enriched foods and bone mass growth in prepubertal girls: a randomized, double-blind, placebo-controlled trial.
- The Association between Dietary and Circulating Copper Levels and Osteoporosis: a Scoping Review.
- Association between dietary copper, iron, zinc, selenium intake and osteopenia or osteoporosis in elderly hypertensive patients: a retrospective cohort study.
- Associations of dietary copper intake with total bone mineral density and lumbar spine bone mineral density in American adults.
- The association between dietary mineral intake and bone mineral density: a cross-sectional study.
- Association between dietary copper intake and bone mineral density in children and adolescents aged 8-19 years: A cross-sectional study.
- Association between RBC folate and lumbar bone mineral density in postmenopausal women, a cross-sectional study from NHANES 2009-2018.
- Genetic variants modify the associations of concentrations of methylmalonic acid, vitamin B-12, vitamin B-6, and folate with bone mineral density.
- Adequate Intake and Supplementation of B Vitamins, in Particular Folic Acid, can Play a Protective Role in Bone Health.
- Relation of homocysteine, folate, and vitamin B12 to bone mineral density of postmenopausal women.
- Dietary intake of folate, but not vitamin B2 or B12, is associated with increased bone mineral density 5 years after the menopause: results from a 10-year follow-up study in early postmenopausal women.